UK Food Inspection Statistics 1997
Details of the inspection statistics for the UK for 1997 have been released (later than in previous years) by the Ministry of Agriculture, Fisheries and Food (MAFF). The statistics have been compiled for submission to the EU Commission as required by the Directive on the Official Control of Foodstuffs.
The data is available by country (England, Wales, Scotland and Northern Ireland) in addition to the combined data for the whole of the UK. It is this last set which is used for the analysis presented here.
The statistics are derived from data submitted to MAFF by all food enforcement authorities active in 1997 and cover the period January to December 1997. The data were published on four forms (Forms A-D). The forms are identical to those used in 1996. Some additional notes are provided by the Ministry to assist in the interpretation of the data. In particular, MAFF note that the statistics, which are prepared in a format to meet EC requirements, reflect in quantitative terms the amount of field work by way of inspection of premises and sampling that enforcement authorities have carried out and the numbers of prosecutions that have been pursued. They do not reflect the quality of the field work.
They further add that official food control does not consist only of inspections, sampling and prosecutions. There are a number of other important activities which rightfully absorb a considerable amount of the available resource of the individual enforcement authorities. Amongst these activities are:-
- the operation of the “home authority” principle whereby the enforcement authority in whose area the headquarters of a national or international company is based provides advice on all aspects of compliance with food law and acts as liaison and advisory point for other enforcement authorities who may have problems arising from the marketing of that Company's products in their area; this responsibility will fall more heavily on some authorities than others;
- similar provision of advice to locally based businesses on compliance with all aspects of food law;
- advice to consumers on the operation and enforcement of official controls and the application of food law;
- operation of schemes to provide for the training of food handlers in food hygiene; and
- remedial action on infringements which fall short of prosecution, including written warnings and the issue of formal cautions (a formal legal proceeding under which the defendant agrees that there has been an infringement of the law and the circumstances can be kept on record for the future).
The statistics must therefore be examined against this background. It should also be noted that action on false descriptions of food can also be taken under other legislation and this information is not included in the summary tables.
The statistics also exclude:-
- meat hygiene inspections carried out under EC Veterinary Legislation;
- milk hygiene inspections of production holdings;
- inspections carried out by the Wine Standards Board under EC wine legislation;
- inspections of Marketing (Grading) Standards in the fisheries and Horticultural areas;
- pesticide residues sampling for which a separate return is required under Directive 90/642;
- food surveillance work carried out by Central Government e.g. radioactive contamination monitoring.
The data is now available from the MAFF web pages. It can be found at:
http://www.maff.gov.uk/food/enforce/ocf.htm
Comments on the Data.
Form A provides general information about enforcement activity. Having been very constant at between 615,000 and 620,000, the number of establishments subject to inspection fell in 1996 to 581,000 and has fallen further to 554,089. The fall included a drop in 12,600 in the number of retailers and in 13,700 in the number of restaurants and other caterers.
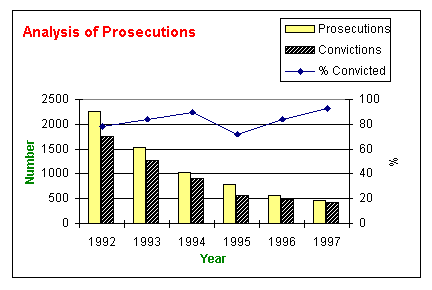
The number of prosecutions has dropped again and continues the trend of the last 5 years. At 466, it is now only 21% of the number taken in 1992. The conviction rate of 93% is the highest recorded since the data started in 1992. See Figure 1.
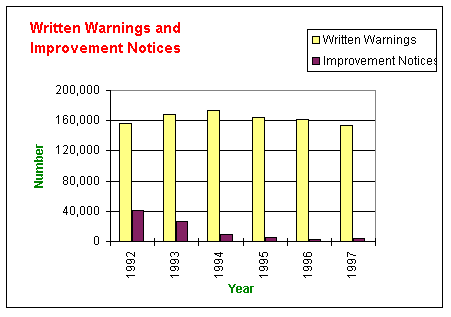
There was a rise in the use of the improvement notice - the first rise since recorded. However, at 3,399 (1996: 3,119) it is still only now only 8.2% of the number issued in 1992. The number of written warnings has again dropped slightly but is in line with previous years. See Figure 2.
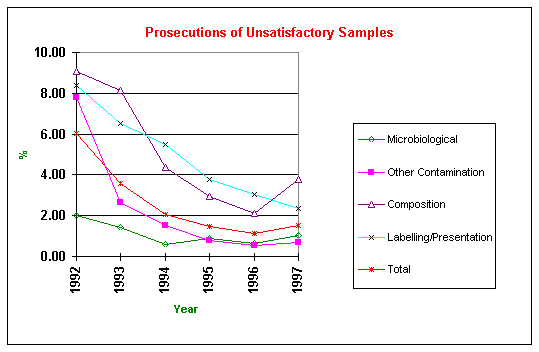
Data from Form B reflects the decline in prosecutions with drops in all the main categories. Data from Form C shows a slight rise in the number of formal samples (1997, 65,130; 1996, 62,350). The number of unsatisfactory samples has however declined slightly (1997, 18,718; 1996, 19,035). The resulting number of prosecution has increased slightly (1997, 282; 1996, 216). Overall this represent a prosecution rate of about 1.5%. The figure depends on the type of problem as is indicated in Figure 3. It will be seen that there was a rise in several categories reversing the general trend since 1992.
Data from Form D indicate a further fall in the level of informal sampling (1997, 158,687; 1996, 168,972).
This page was first provided by David Jukes on 21st July 1999.